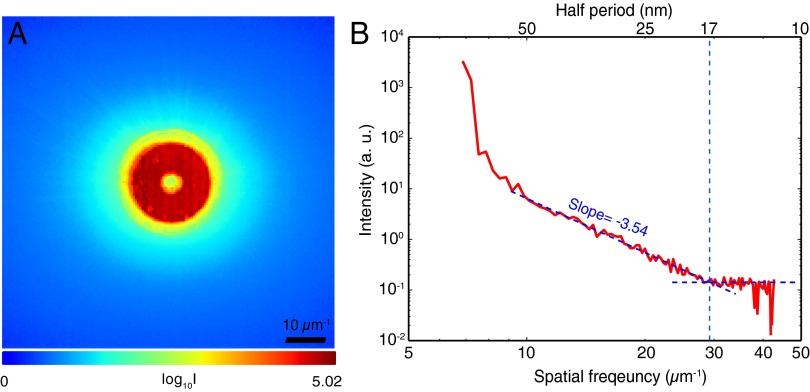
Fig. 2.
View of the ptychographic data produced by X-ray diffraction from a frozen-hydrated Ostreococcus alga, acquired at 5.2-keV photon energy. (A) The average (logarithmic scale) of 4,000 far-field diffraction pattern recordings from the cell region within the 100 × 100-point scan; the high-intensity red annulus represents the incident beam focused by a Fresnel zone plate with a central stop, whereas the light blue areas represent significant scattering from the cell (the speckles of individual diffraction patterns are not visible in this summed image). By subtracting the diffraction pattern measured with no sample present, and carrying out an azimuthal average, one arrives at B, which is a plot of diffraction from the alga as a function of spatial frequency f. The diffraction intensity signal S decreases as until, at a length scale with a half-period of about 17 nm, it reaches a flat region consistent with spatially uncorrelated noise fluctuations.

