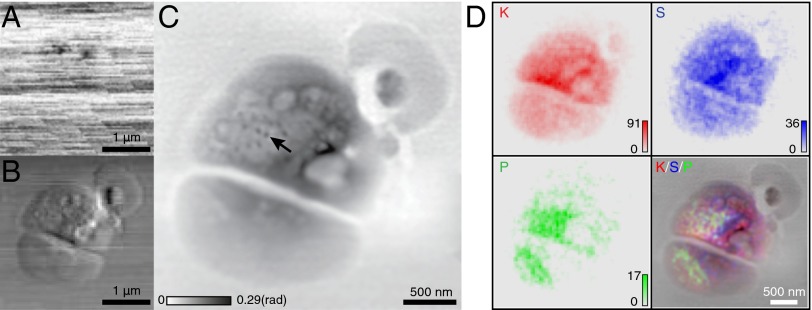
Fig. 3.
Images of a frozen-hydrated Ostreococcus alga obtained from 100 × 100-point scan data. (A) Absorption contrast image of the alga, obtained from the total signal recorded on the pixelated area detector at each scan point. (B) Differential phase contrast image in the horizontal direction, obtained by plotting the first moment of the diffraction patterns as a function of position. (C) Phase of the sample complex transmission function reconstructed via ptychography. The arrow points to structures that resemble ribosome-like complexes observed in cryo electron microscopy studies of similar algae (46). (D) X-ray fluorescence maps of the distributions of the elements K, S, and P, along with their color-composite overlay on the ptychographic image C. For the fluorescence images, the numbers of X-ray photons recorded per pixel dwell time are shown as “counts.” The presence of K within the cell suggests good preservation of membrane integrity in the frozen-hydrated sample preparation.

