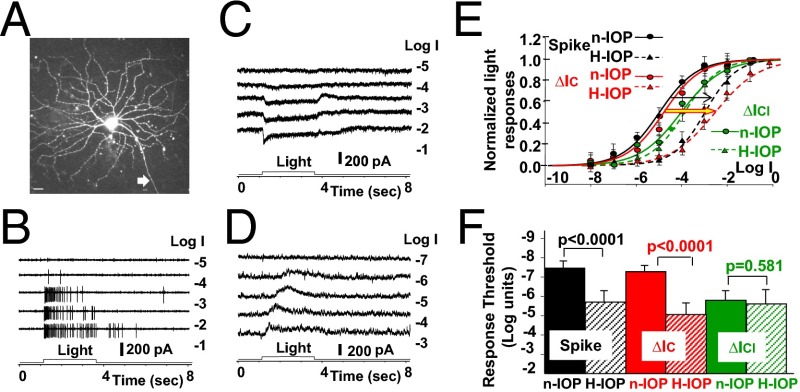
Fig. 2.
Light responses of ONαGCs in high-IOP and normal-IOP mice. (A) Confocal image of an LY-filled ONαGC in an H-IOP mouse (white arrow, axon). (Scale bar, 20 µm.) (B–D) The cell’s light-evoked spike responses, cation current, and chloride current to 500-nm light steps of various intensities are shown in B–D, respectively. (E) The normalized, average response–intensity relations of six ONαGCs in H-IOP mice [population Rmax (mean ± SE) for spike, ΔIC, and ΔICl responses: 88 ± 37 per s, 203 ± 16 pA, and 194 ± 18 pA] are shown as dotted curves, whereas the corresponding R-Log I relations obtained from ONαGCs in normal mice [n = 18, population Rmax (mean ± SE) for spike, ΔIC, and ΔICl responses: 97 ± 42 per s, 218 ± 21 pA, and 183 ± 13 pA) are shown as solid curves for comparison. Black, spike responses; red, ∆IC; green, ∆ICl. Arrows indicate H-IOP–induced shifts of the R-Log I relations. (F) Bar graphs of the average light response thresholds (mean ± SE), defined as the light intensity eliciting 5% of the maximum response of spike responses, ∆IC, and ∆ICl in control and H-IOP mouse retinas; the significance levels of the threshold differences are given by the P values of the t test.

