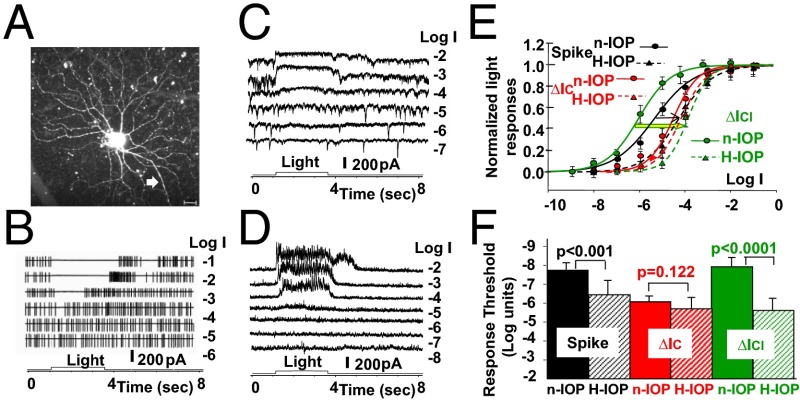
Fig. 3.
Light responses of sOFFαGCs in H-IOP and n-IOP mice. (A) Confocal image of an LY-filled sOFFαGC in an H-IOP mouse (white arrow, axon). (Scale bar, 20 µm.) (B–D) The cell’s light-evoked spike responses, ΔIC, and ΔICl to 500-nm light steps of various intensities are shown in B–D, respectively. (E) The normalized, average R-Log I relations of seven sOFFαGCs in H-IOP mice [population Rmax (mean ± SE) for spike, ΔIC, and ΔICl responses: 12 ± 8 per s, 181 ± 15 pA, and 250 ± 25 pA] are shown as dotted curves, whereas the corresponding R-Log I relations obtained from sOFFαGCs in n-IOP mice [n = 15, population Rmax (mean ± SE) for spike, ΔIC, and ΔICl responses: 14 ± 8 per s, 162 ± 16 pA, and 241 ± 33 pA) are shown as solid curves for comparison. Black, spike responses; red, ∆IC; green, ∆ICl. Colored arrows indicate H-IOP–induced shifts of the R-Log I relations. (F) Bar graphs of the average light response thresholds (mean ± SE) of spike responses, ∆IC, and ∆ICl in n-IOP and H-IOP mouse retinas; the significance levels of the threshold differences are given by the P values of the t test.

