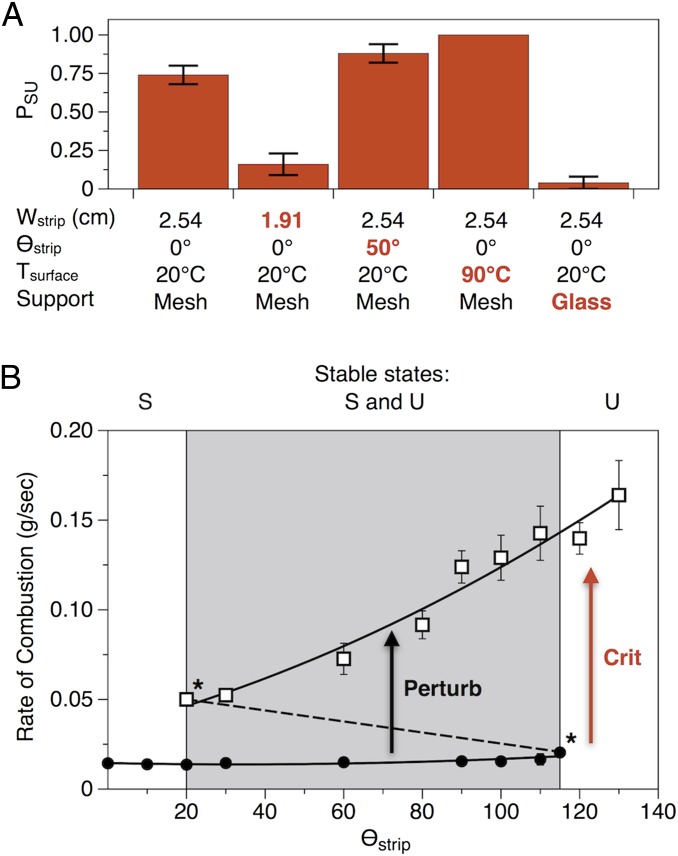
Fig. 3.
Conditions that alter the probability of transitions. (A) A chart revealing the influence of various environmental conditions on the probability of structured-to-unstructured transitions (PSU). Values of PSU increased with the width of the strip and the angle, temperature, and porosity of the support surface. Error bars represent SE (n ≥ 25). (B) An experimentally mapped bifurcation diagram: rates of combustion associated with structured (closed circle, ●) and unstructured (open square, □) flames propagating along 1.27-cm strips positioned at different angles (θstrip). Lines represent fits consistent with trends exhibited by points: structured (quadratic, r2 = 0.73), unstructured (quadratic, r2 = 0.97). Bifurcation points associated with structured-to-unstructured (θstrip = 115°) and unstructured-to-structured (θstrip = 20°) critical transitions are marked with an asterisk. The dashed line marks a linear approximation of the region of the curve corresponding to unstable fixed points. Arrows are as follows: (white) a contour-initiated transition from the structured regime to the unstructured regime (similar to that shown in Fig. 1C); (red) a critical transition caused by increasing θstrip beyond the bifurcation point at 115°. Regions of stability for structured flames (S), unstructured flames (U), and both structured and unstructured flames (S and U, gray) are labeled at the top of the plot. Error bars represent SE (n ≥ 7).

