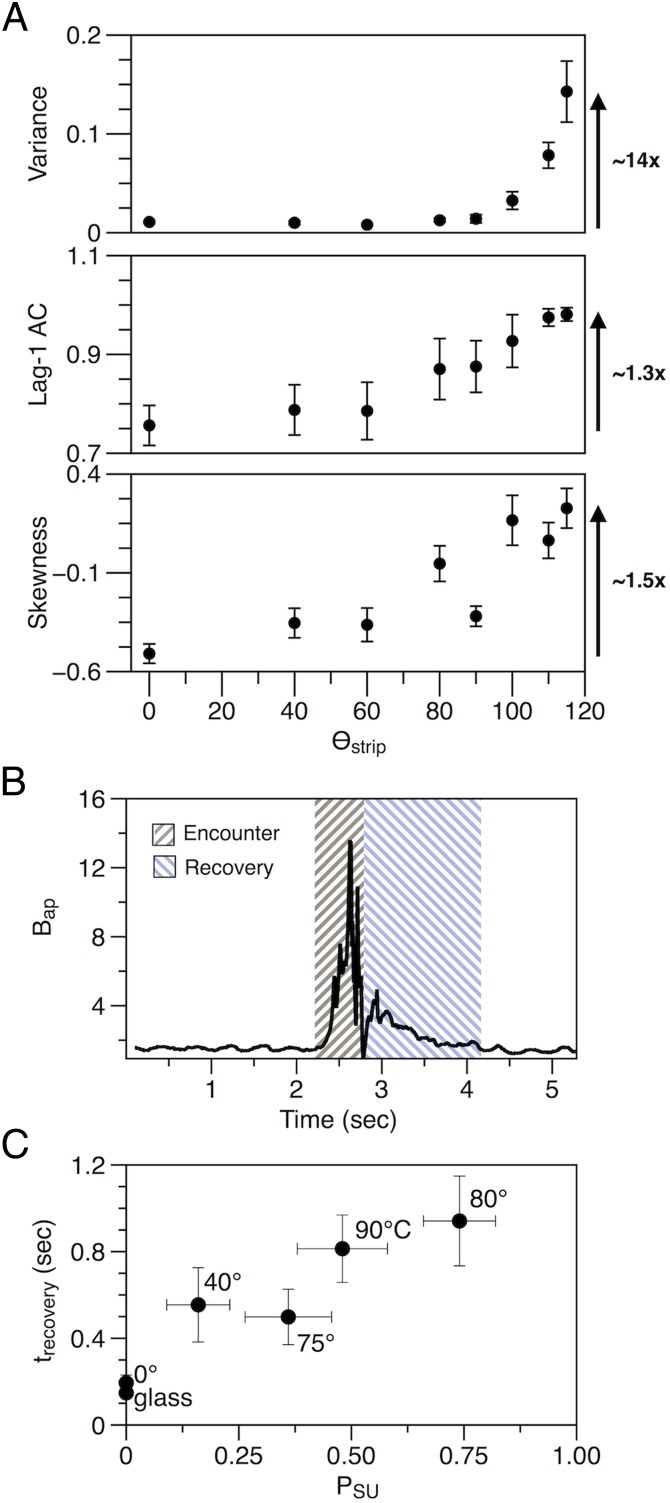
Fig. 4.
Symptoms of critical slowing down. (A) Variance, lag-1 autocorrelation, and skewness in Bap for structured flames propagating along strips (1.27-cm) positioned at various angles to a level surface (θstrip). To the right of each plot, labeled arrows indicate the extent to which each parameter increased from 0° to 115° (i.e., upon approach to the structured-to-unstructured bifurcation point at θstrip = 115°). Variance increased by an order of magnitude, whereas autocorrelation or skewness increased only slightly (∼1.5-fold). For each value of θstrip, corresponding values of statistical parameters in each plot were calculated from the same dataset. Error bars represent SE (n ≥ 10). (B) Mean values of brightness for sequential high-speed images of a contour-initiated perturbation (1.27-cm strip, θstrip = 80°) show a distinct period of recovery after encounter of a bump. (C) The mean duration of the recovery (trecovery) for different contour-initiated perturbations for a 1.27-cm strip. Values of trecovery increase with PSU (i.e., upon approach to structured-to-unstructured bifurcation points), providing direct evidence of critical slowing down. Error bars represent SE (n ≥ 25 for PSU, n ≥ 10 for trecovery).

