Fig. 1.
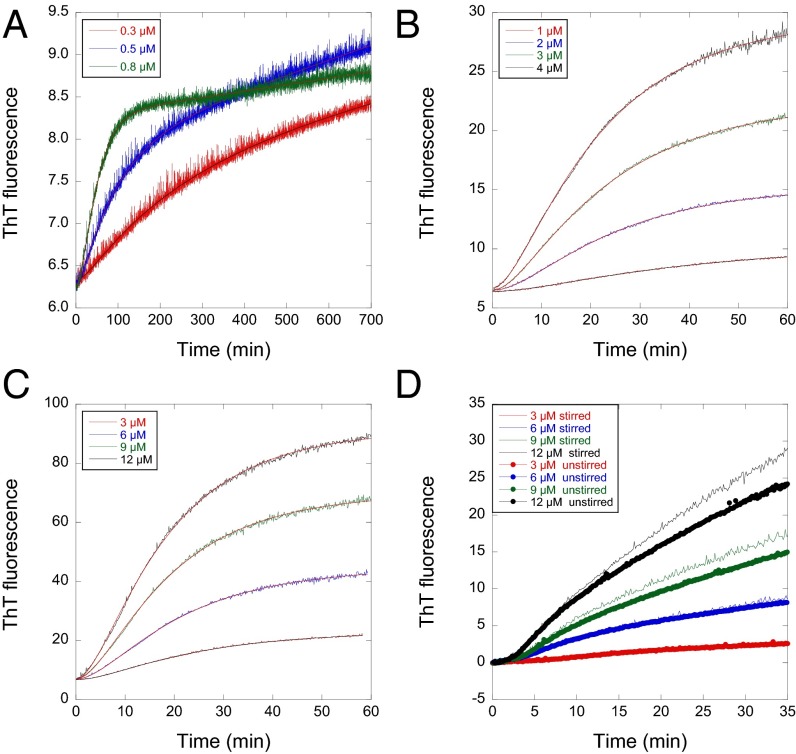
Aggregation traces of p53 monitored by ThT can be fitted well with Eq. 1 at wide protein concentration range and different stirring conditions. (A–C) Time courses at 37 °C for QCYC from 0.3 to 12 µM. The linear drift term in Eq. 1 was used only when protein concentrations were lower than 0.8 µM. (D) WTC stirred and unstirred. They are fitted to Eq. 1 without the linear drift term. Unstirred had lower amplitudes but fitted to similar rate constants with Eq. 1.

