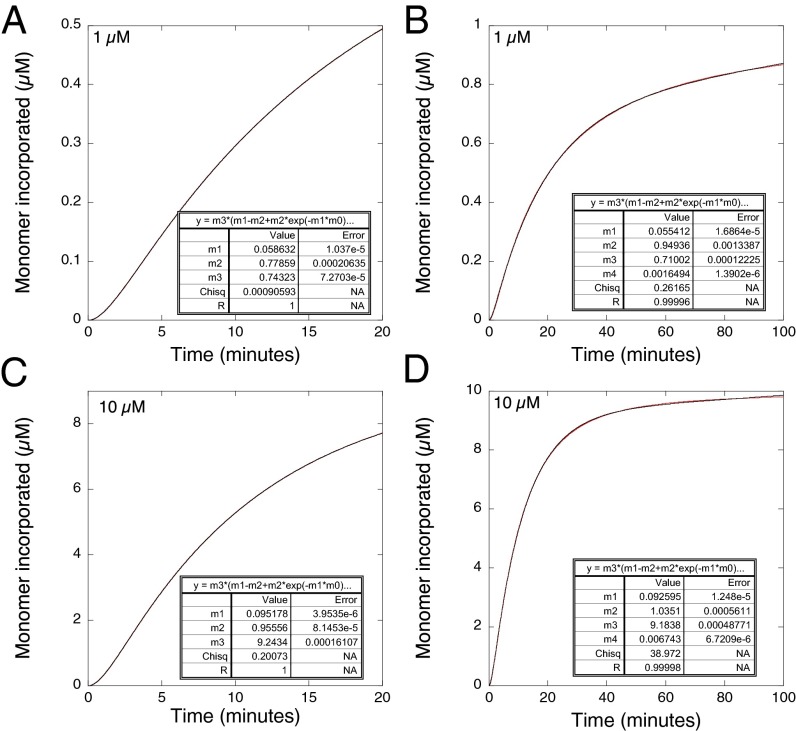
Fig. 4.
Simulated plots for Scheme 2 where k+1 = 0.05 min−1, k-1 = 0.5 min−1, k+2/k-2 = KD = 2 µM, k+3 = 1 min−1. Short and long time courses of protein aggregation at (A and B) low and (C and D) high concentrations. Data (red) were fitted (black) to Eq. 1, without the term a so the plots start from the origin. The 20-min time courses omitted the linear drift term from Eq. 1.

