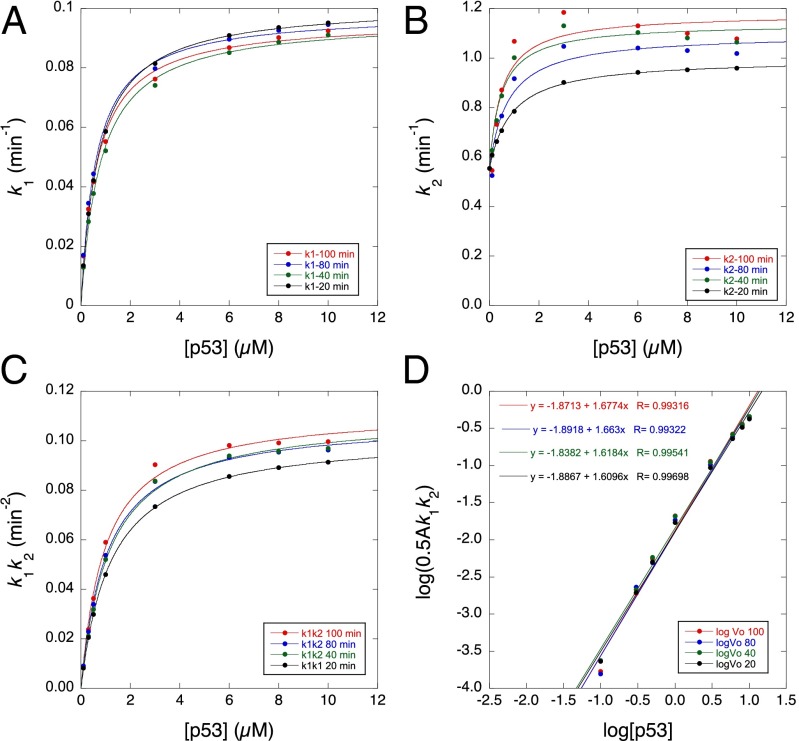
Fig. 5.
Derived rate constants from simulated plots using the same inputs as in Fig. 4 vs. protein concentration for time courses of 20, 40, 80, and 100 min (0.1–10 µM protein for k1 and 0.03–10 µM for k2). Concentration dependence of rate constants (A) k1, (B) k2, (C) k1k2, and (D) initial aggregation rate. Time courses over 20 and 40 min were fitted to Eq. 1 without the linear drift term, which was included for 80 and 100 min. The term a was included to mimic the fitting of data in experiments. The values of k1 and k2 plotted are the observed values from fitting aggregation curves given by Scheme 2 with Eq. 1 as shown in Fig. 4 and not the microscopic values in Scheme 2.

