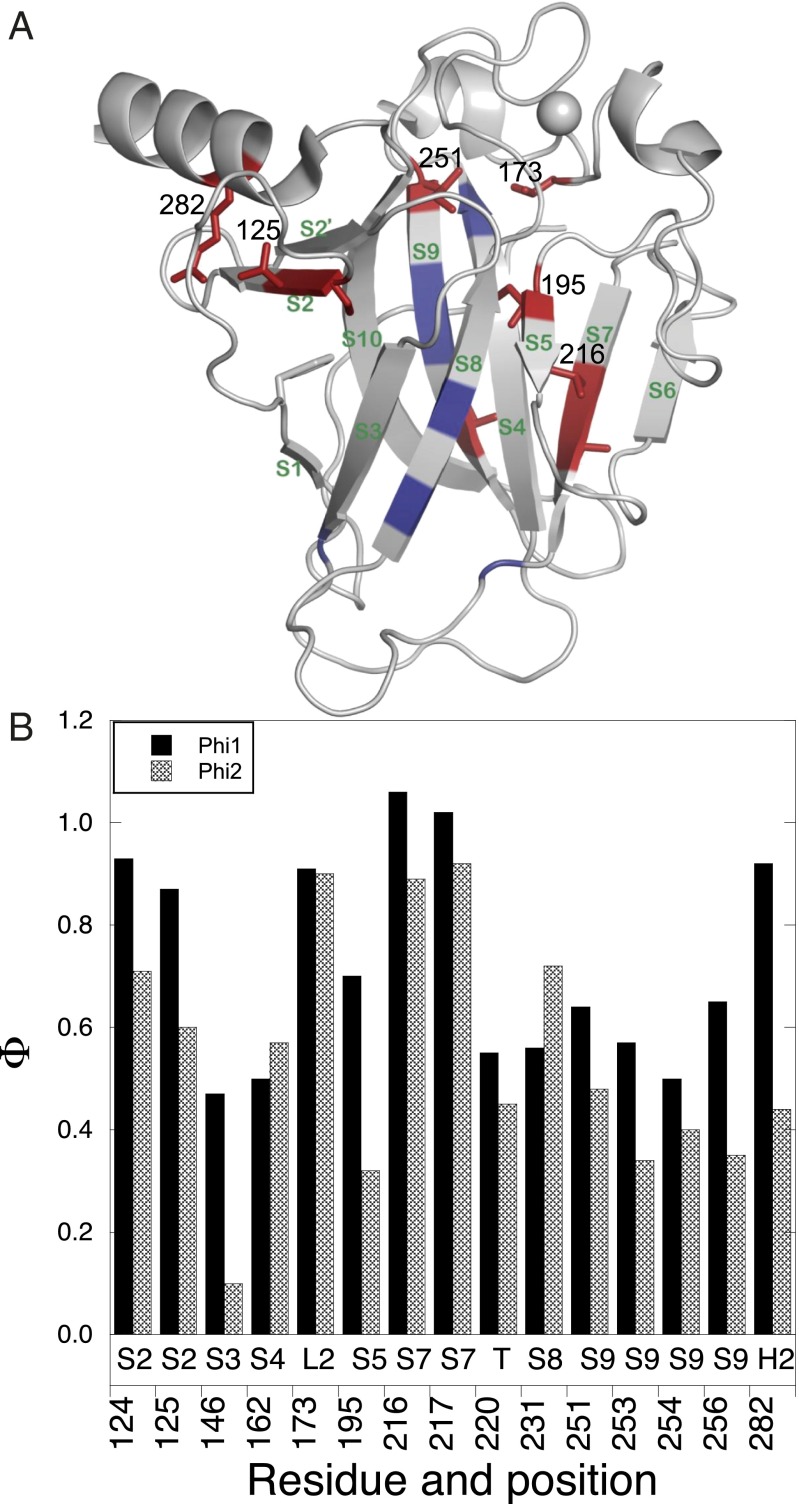
Fig. 6.
Φu values of p53 core domain during aggregation. (A) Φu values are mapped on the native structure and are color coded: residues with Φu values between 1.0 and 0.6, red; lower than 0.6, deep blue. The side chains of residues with Φu >0.6 are shown explicitly. (B) Φu values for different positions.

