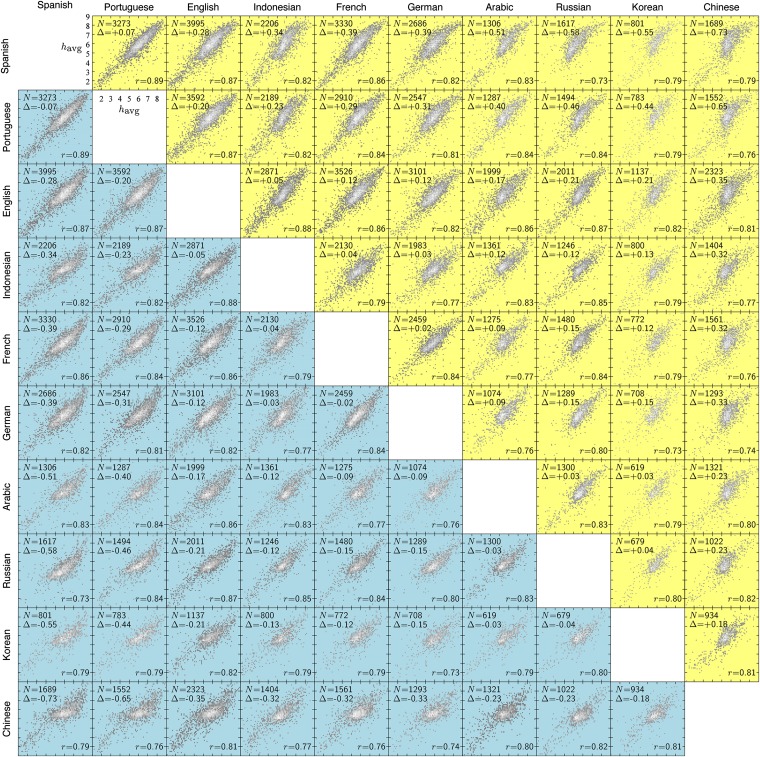
Fig. 2.
Scatter plots of average happiness for words measured in different languages. We order languages from relatively most positive (Spanish) to relatively least positive (Chinese); a yellow background indicates the row language is more positive than the column language, and a blue background indicates the converse. The overall plot matrix is symmetrical about the leading diagonal, with the redundancy allowing for easier comparison between languages. In each scatter plot, the key gives the number of translation-stable words for each language pair, N; the average difference in translation-stable word happiness between the row language and the column language, ; and the Pearson correlation coefficient for the regression, r. All P values are less than for the Pearson correlation coefficient and less than for the Spearman correlation coefficient.

