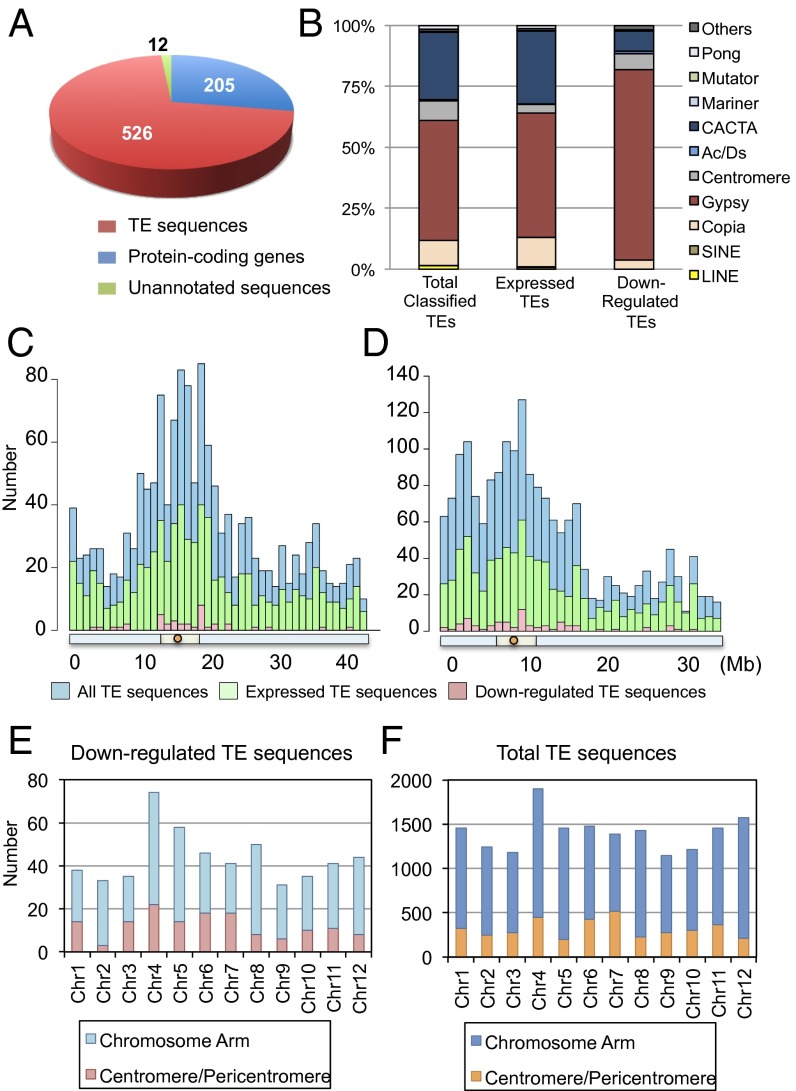
Fig. 7.
Characterization of down-regulated TE sequences. (A) Number and kinds of genes down-regulated during the early stage of floral induction. (B) Composition of total rice TEs, TEs expressed in the shoot apex, and TEs down-regulated by Hd3a florigen. Down-regulated TEs were classified into known groups of transposons and retrotransposons, and unclassified TEs were not included. (C and D) Distribution of all TE sequences, those expressed in the vegetative shoot apex, and those down-regulated, along rice chromosomes 1 (C) and 4 (D). Red circles, light green bars, and light blue bars below the histograms indicate centromeres, pericentromeric regions, and chromosome arms, respectively. (E and F) Distribution of down-regulated (E) and total (F) TE sequences in different regions of rice chromosomes.

