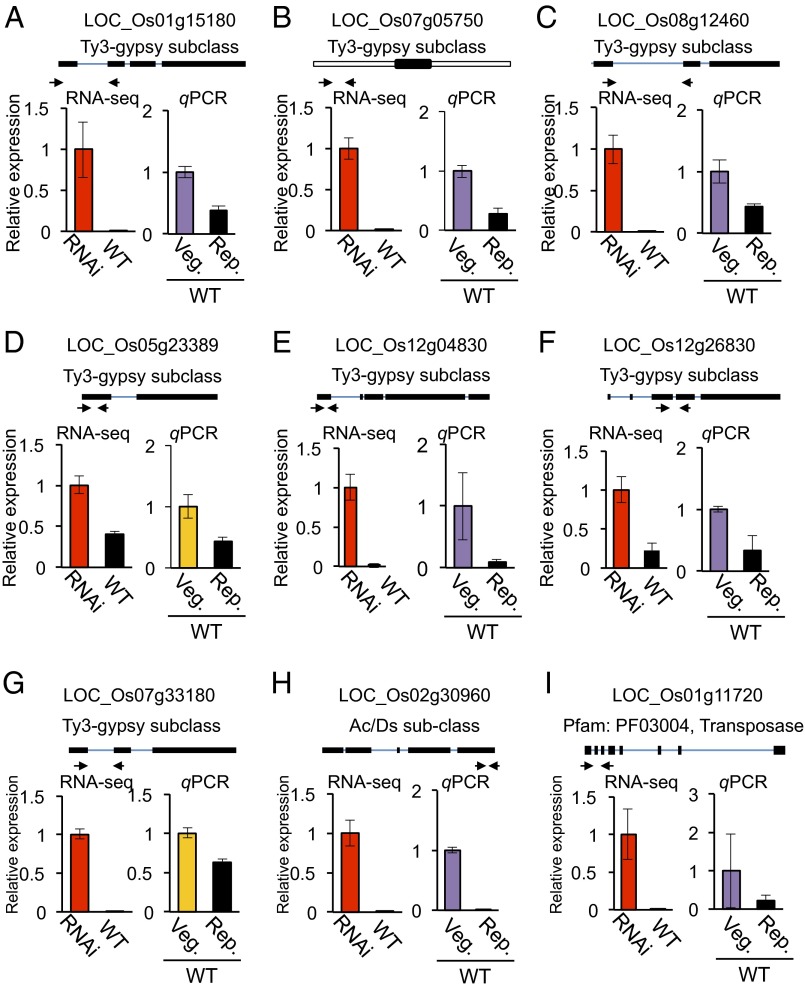
Fig. 8.
(A–I) Validation of down-regulated TE sequences. Selected TE sequences that were down-regulated during floral induction by Hd3a florigen are shown. Upper indicates the locations of qPCR primers (arrows). Thick and thin lines indicate exons and introns, and the open boxes in B indicate UTRs. Lower shows RNA-seq (Left) and qPCR (Right) data for WT-vegetative (Veg.) and WT-reproductive (Rep.) samples.

