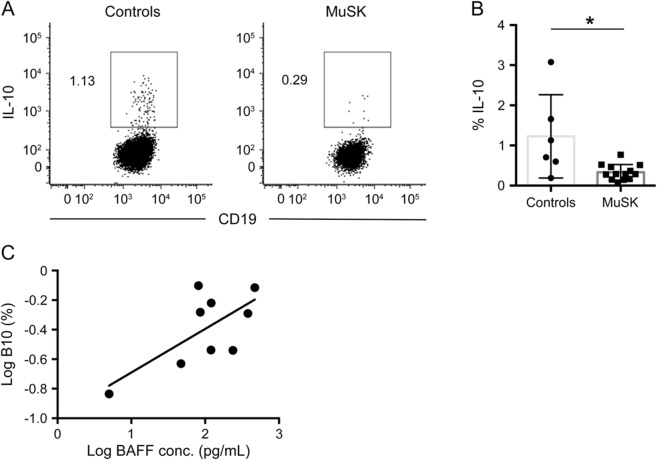
Figure 3. Lower percentages of B10 cells in MuSK MG.
(A) Intracellular cytokine analysis for interleukin (IL)-10 following 48-hour stimulation with rCD40L and LPS (BFA, PMA, and ionomycin for the last 5 hours). Representative plots in a healthy control and a patient with muscle-specific tyrosine kinase (MuSK) myasthenia gravis (MG) are gated on CD19+ cells, and the numbers in the plots represent the frequency of IL-10–positive events. (B) Comparison of the mean percentages of B10 cells in healthy controls and patients with MuSK MG (n = 13; p = 0.013). (C) Comparison of B10 cell percentages and B cell–activating factor (BAFF) levels in patients with MuSK MG (p = 0.041).

