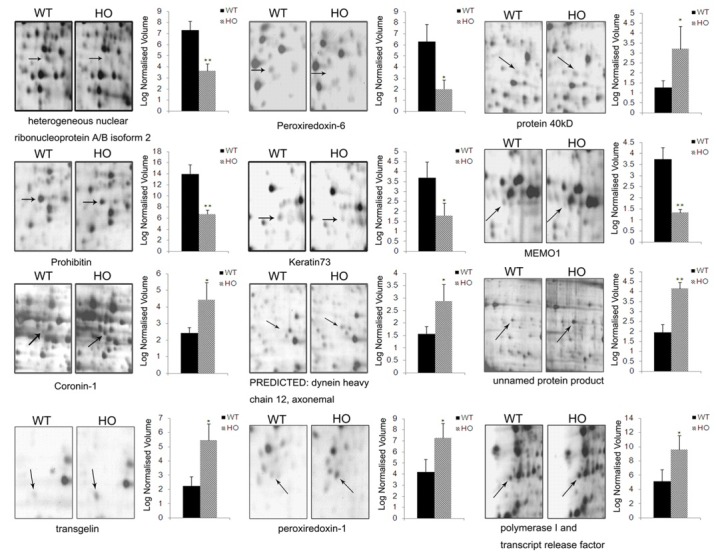
Fig. 2. Close-up of the regions of differentially expressed protein spots and statistical analysis of the normalized spot volumes. Three independent experiments were performed and the mean ± SD was plotted (*P < 0.05, **P < 0.01 compared with wild-type mice).

