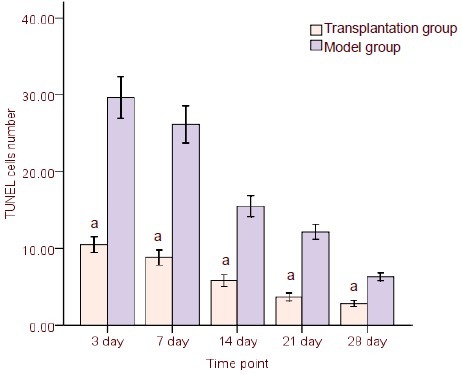
Figure 3.

Comparison of apoptotic rate of cells between transplantation and model groups at different time points (terminal deoxynucleotidyl transferase dUTP nick-end labeling, TUNEL).
Cell number (/200-fold field of view) is presented as mean ± SD from six rats/group at each time point.
aP < 0.05, vs. model group (t-test was used to specify differences between two groups at corresponding time points).
