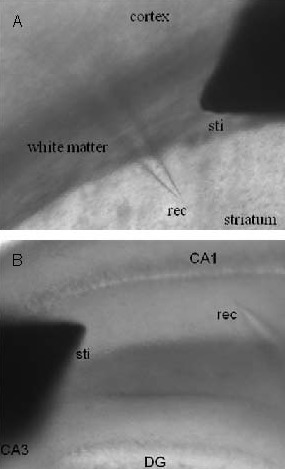
Figure 6.

Schematic diagram of the field potential recording from the dorsal striatum (A) and hippocampus (B).
Sti: Stimulator; rec, recording electrode; DG: dentate gyrus.

Schematic diagram of the field potential recording from the dorsal striatum (A) and hippocampus (B).
Sti: Stimulator; rec, recording electrode; DG: dentate gyrus.