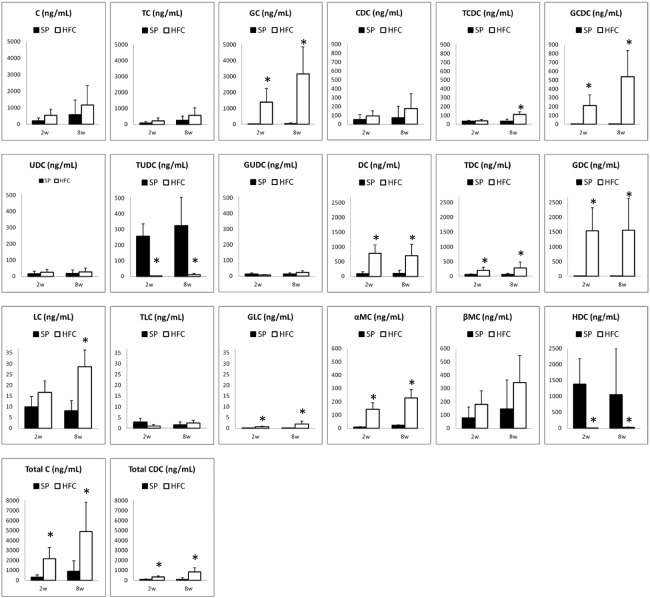
Fig. 3.
The values of BAs in serum samples of SHRSP rats fed with control (SP) diet (shown in filled bars) and high fat and cholesterol-containing (HFC) diet (shown in open bars). The C or CDC group represents the sums of C, TC and GC, or CDC, TCDC and GCDC, respectively. The values of DHC, TDHC, and GDHC were below the LOQ values (data not shown).
*: significant differences between each of the samples fed with SP and each of those fed with HFC diet (p <0.05).

