
Fig. 1.
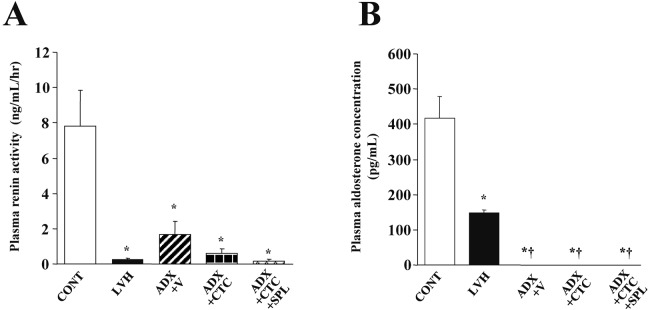
Plasma renin activity and aldosterone concentration in DS rats of the five experimental groups at 11 weeks of age. Renin activity (A) and aldosterone concentration (B) are presented as means ± SEM for animals in each group (n = 8, 7, 10, 10, and 9 for CONT, LVH, ADX+V, ADX+CTC, and ADX+CTC+SPL groups, respectively). *P < 0.05 versus CONT group; †P < 0.05 versus LVH group.