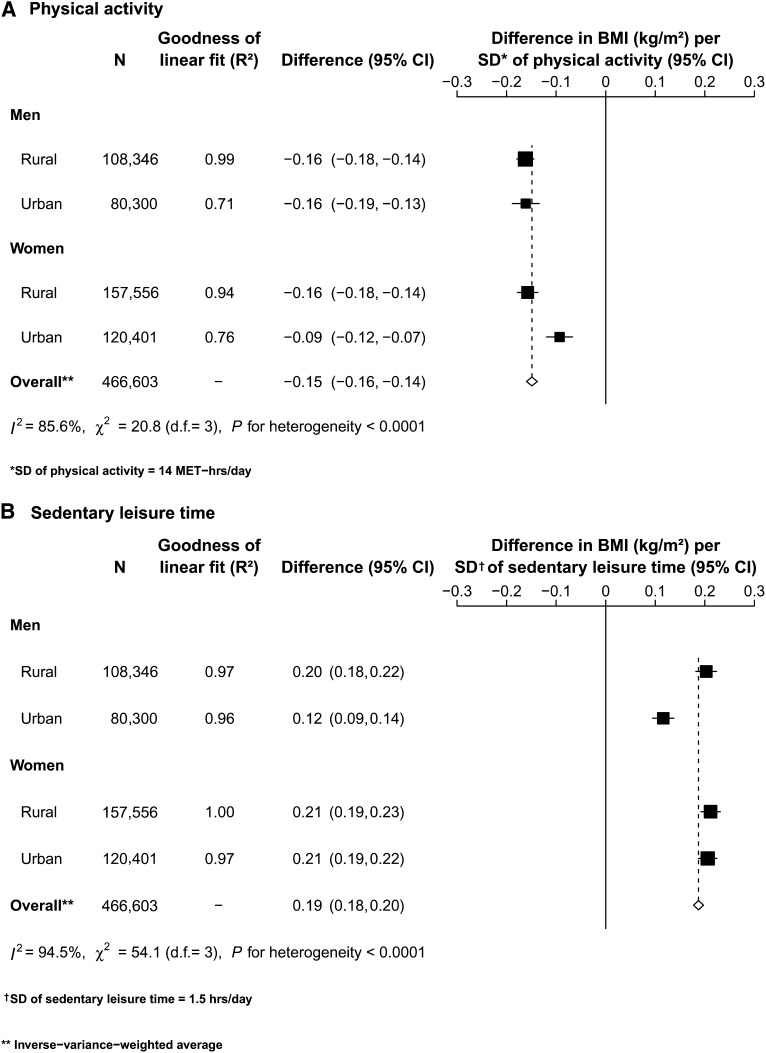
FIGURE 1.
Differences in BMI associated with a 1-SD greater self-reported physical activity (A) or sedentary leisure time (B) among 466,605 participants with no history of major disease (excluding 2 participants with missing values on BMI). Each closed square represents the point estimate of the regression coefficient, and the horizontal bar represents its 95% CI, which was estimated by using multiple linear regression models. Adjustment was made for age (in 5-y intervals), study area, education, and annual household income. The size of the square is proportional to the inverse variance. The overall point estimates, calculated by using inverse-variance weighting, are represented by dotted lines and open diamonds; the width of the diamonds indicates the 95% CI. MET, metabolic equivalent task.

