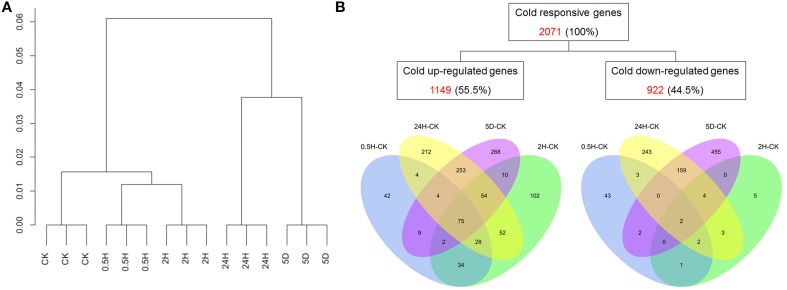
Figure 1.
Expression profiling of cold-regulated genes in petunia seedlings. (A) Hierarchical cluster analysis. (B) Venn diagrams showing cold-regulated genes across four comparisons (0.5 h/0 h, 2 h/0 h, 24 h/0 h, and 5 d/0 h). The red numbers are the total numbers of differentially expressed genes (DEGs); the percentages in parentheses were calculated as the ratio of regulated genes to the total number of cold-regulated genes (2071).

