
Figure 3.
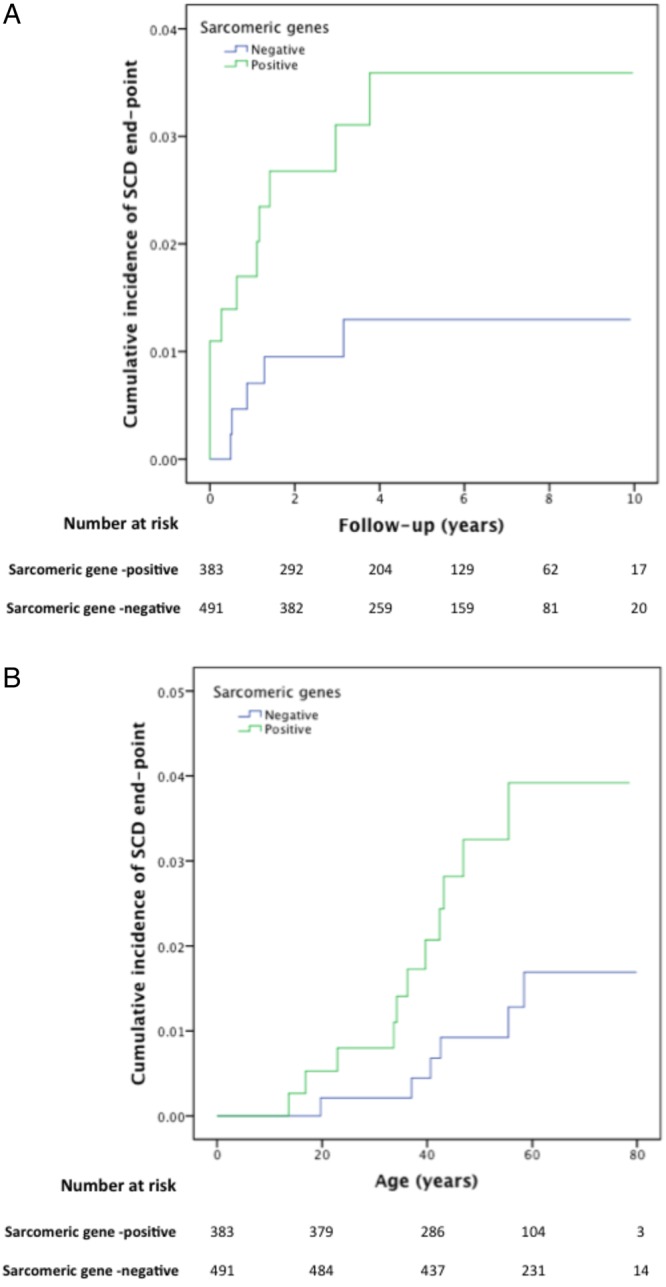
Kaplan–Meier cumulative incidence curves for sudden cardiac death/aborted sudden cardiac death, comparing sarcomere-positive and sarcomere-negative individuals, modelled for (A): follow-up from first evaluation (years), log-rank test p value=0.039 (HR 2.89; 95% CI 1.01 to 8.33) and (B): time from birth (years), log-rank test p value=0.028 (HR 3.44; 95% CI 1.19 to 9.92) . The Y axis values indicate proportions.