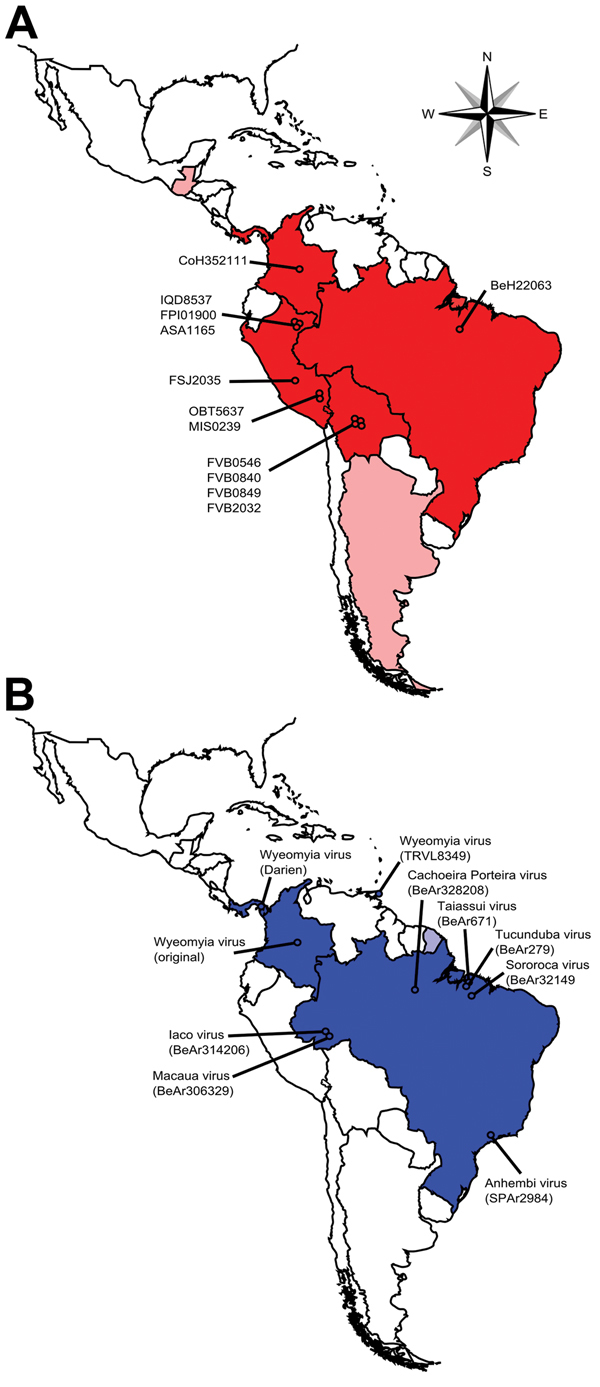
Figure 1.

Comparison of the geographic locations from which Guaroa virus (GROV) strains used in this study were isolated (A) and the geographic distribution of the Wyeomyia virus (WYOV) group (B), Central and South America. Countries from which GROVs have been isolated are shown in dark red; countries from which WYOVs have been isolated are shown in dark blue. Light red indicates countries with only serologic evidence of GROV circulation; light blue indicates countries with only serologic evidence of WYOV circulation. Circles indicate the geographic locations from which the virus strains used in the present study were isolated.
