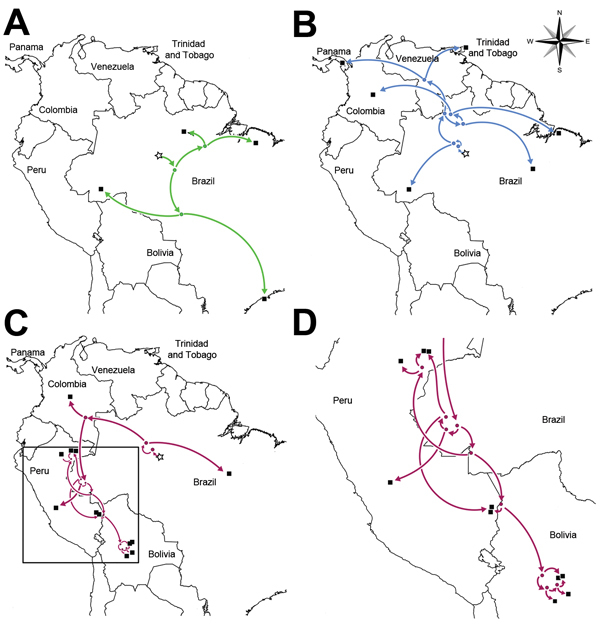
Figure 2.

Spread (arrows) of Wyeomyia virus (WYOV) group viruses and Guaroa virus (GROV) in Central and South America. A) Anhembi lineage WYOV group viruses; B) Wyeomyia lineage WYOV group viruses; C) GROVs. D) Enlargement of boxed area in panel C, showing the spread of GROV in Bolivia and Peru, as determined by phylogeographic analysis. Bayesian coalescent phylogenies incorporating sample times and locations (Technical Appendix Table) were calculated for the nucleoprotein open-reading frame dataset by using BEAST v1.8.0 (http://beast.bio.ed.ac.uk/) and then input into SPREAD v1.0.6 (5) to calculate ancestral locations and corresponding graphical map overlays. Stars in each panel represent the predicted site of introduction for the GROV/WYOV common ancestor; dots represent the predicted locations associated with all other nodes (Technical Appendix Figure). Black boxes indicate the locations at which the viruses used in this study were isolated.
