. 2015 Mar 3;4:e05154. doi: 10.7554/eLife.05154

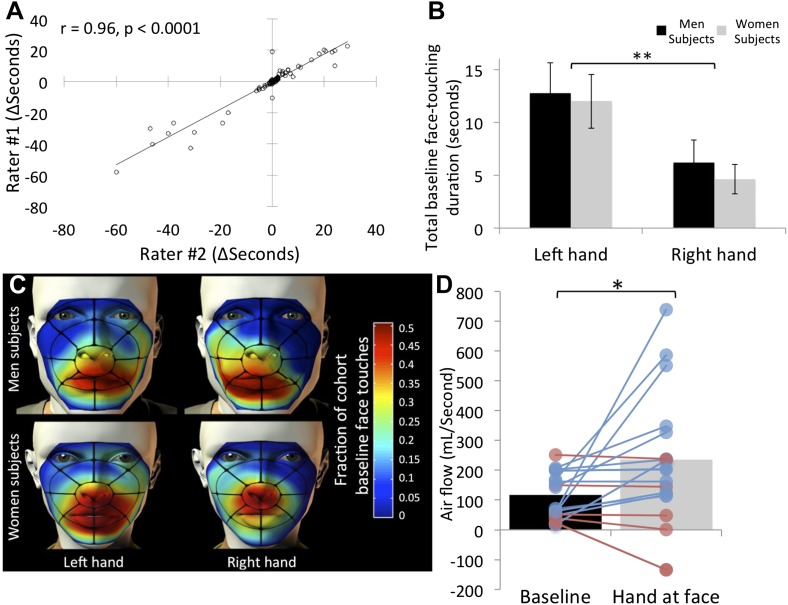
Figure 2. Humans often touch their own face and concurrently sniff.

(A) Agreement in scoring of 153 subjects across two independent raters. (B) Total face touching duration during the 1-min baseline. (C) Spatial distribution of face touching during the 1-min baseline. Grid reflects 17 facial regions. (D) Measure of nasal airflow during baseline vs the time when a hand was at the face. Subjects that increased flow in blue and subjects that decreased flow in red. Solid bars reflect the mean. Error bars in B are standard error. **p < 0.01. *p < 0.05.

DOI: http://dx.doi.org/10.7554/eLife.05154.004

Figure 2.

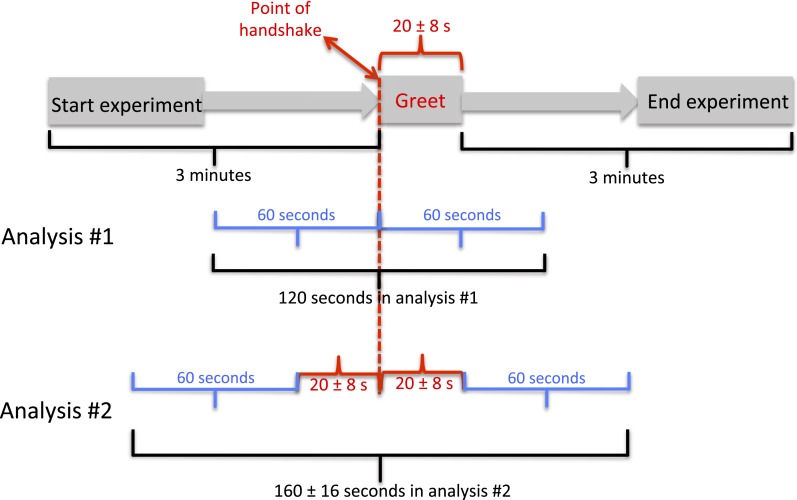
Figure 2—figure supplement 1. Experimental time-course.

Figure 2—figure supplement 1.

We initially decided to analyze 1 min before and 1 min after handshake (analysis #1). We then noted, however, that this analysis may be inappropriate, because in the 60 s post handshake, an experimenter was still in the room for about 20 s with variance across subjects. This variance introduced potential imbalance across subjects. For example, a subject with a 14 s greet was then alone for an added 46 s of observation, yet a subject with a 29 s greet was then alone for an added 31 s of observation. To account for this potential imbalance, we added for each subject his/her individual greet time (20 ± 8 s) to each end (pre and post) of the observation. Thus, we end with ∼80 s before and after the handshake event. The results of these two analyses (120 and ∼160 s) were nearly identical (no effects lost or gained), with slightly stronger effects in analysis #1. We present analysis #2 in the manuscript.