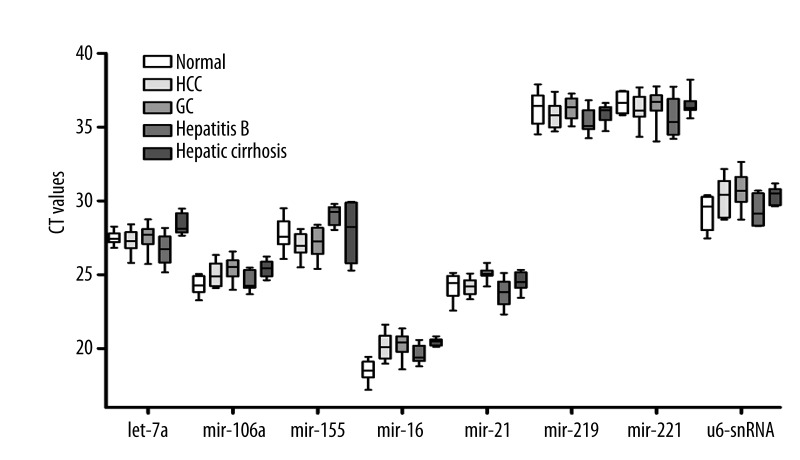
Figure 1.
Expression of candidate reference genes in plasma samples from patients and healthy volunteer. QPCR analyses were performed on the 120 samples collected. The expression levels of the candidate reference genes are given as absolute Cq values. Boxes represent the lower and upper quartiles with the medians as horizontal lines; whiskers depict the min and max Cq values. No statistical differences were found among the different sources of plasma in all the quantified target microRNAs and U6-snRNA.

