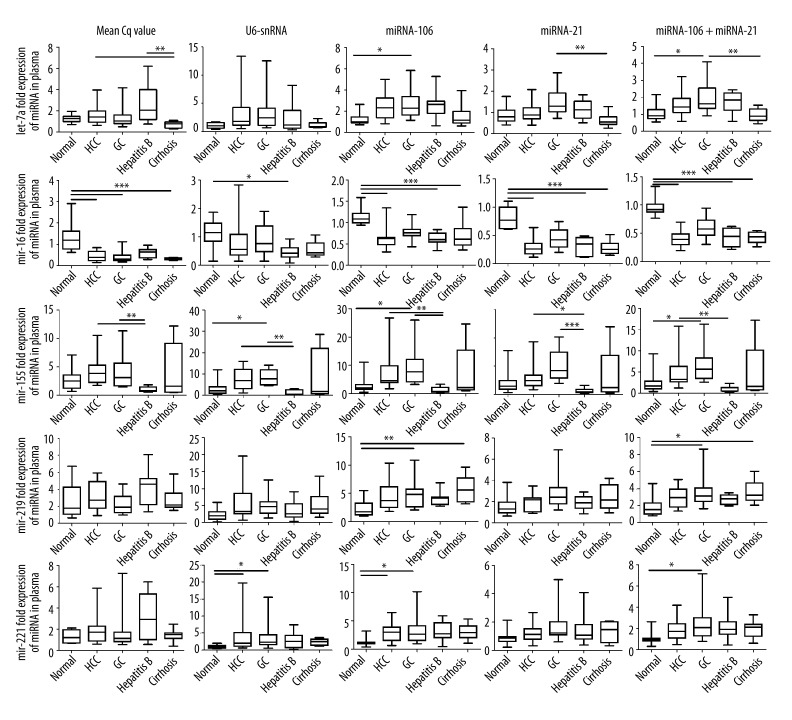
Figure 2.
Reference gene selection intensively affects the results of relative qRT-PCR. Relative quantities of plasma microRNAs in patients and healthy volunteers were determined by different standardized methods. Expression levels of plasma let-7a, miRNA-16, miRNA-219, miRNA-221, and miRNA-155 were normalized by sample volume, U6-snRNA, miRNA-21, miRNA-106a, or the geometric mean of miRNA-21 and miRNA-106a, respectively. Boxplots show interquartile ranges and medians; whiskers indicate the min to max ranges. Normal: healthy controls; HCC: hepatic carcinoma; GC: gastric cancer. Asterisks indicate significant differences between groups (*, P<0.05; **, P<0.01; ***, P<0.001).

