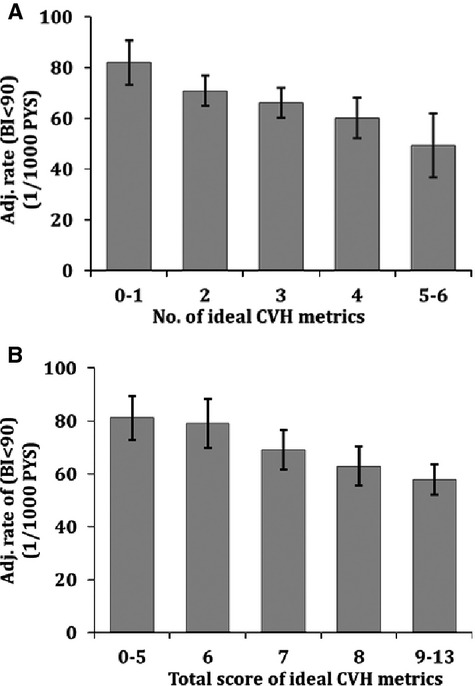
Figure 2.

Adjusted incidence rates of BI<95 by the number of ideal health metrics (A) and by total score of CVH metrics for BI<95 (B). Incidence rates were adjusted for age, sex, race‐ethnicity, education, health insurance, marital status, number of friends, moderate alcohol drinking, depression, history of coronary artery disease, and history of peripheral vascular disease. BI indicates Barthel index; CVH, cardiovascular health; PYS, person years. Errors bars are significant at P < 0.05.
