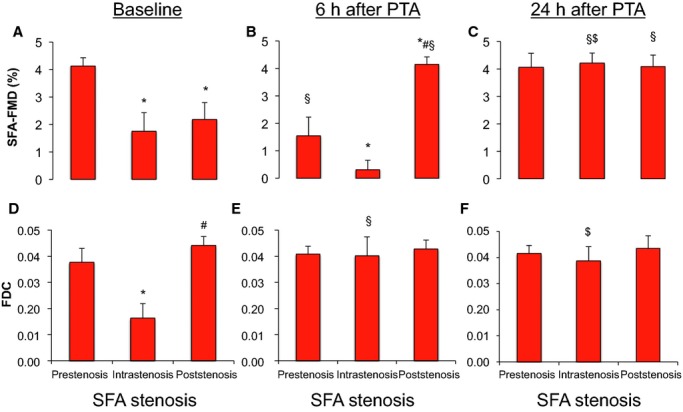
Figure 3.

FMD (A–C) and FDC (D–F) of SFA pre‐, intra‐, and poststenosis at baseline before (A, D), at 6 hours (B, E), and 24 hours (C, F) after PTA. *P<0.05 vs prestenosis at same time, #P<0.05 vs intrastenosis at same time, §P<0.05 vs baseline at same location, $P<0.05 vs 6 hours after PTA at same location (1‐way repeated measures ANOVA). FDC indicates fractional diameter change; FMD, flow‐mediated vasodilation; PTA, percutaneous transluminal angioplasty; SFA, superficial femoral artery.
