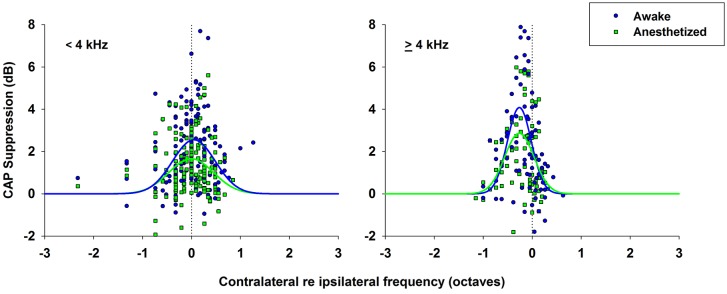
Figure 10.

CAP suppression as a function of contralateral suppressor frequency re ipsilateral frequency. CAP suppressions as a function of the difference between contralateral frequencies and ipsilateral frequencies (in octaves) for all data in awake (blue circles) and anesthetized (green squares) animals. Normal distributions fitted to data, awake (blue line), anesthetized (green line). (Left) CAP suppression for ipsilateral frequencies <4 kHz. Awake, ; anesthetized, . (Right) CAP suppression for ipsilateral frequencies ≥ 4 kHz. Awake, ; anesthetized, .
