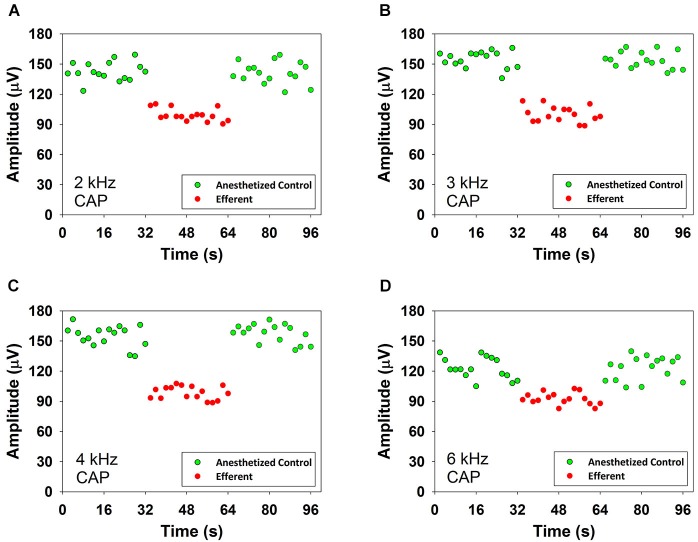
Figure 3.
CAP suppression produced by contralateral acoustical stimulation in an anesthetized chinchilla. Reductions of CAP amplitudes in response to ipsilateral tones obtained in the presence of contralateral broad-band noise (55 dB SPL). Each symbol represents the average CAP amplitude of two consecutive trials. The red circles correspond to responses to ipsilateral tones preceded by contralateral efferent stimulation. The green circles correspond to responses to ipsilateral tones alone, before and after contralateral efferent stimulation. Panel (A): 2 kHz at 47 dB SPL, panel (B): 3 kHz at 50 dB SPL, panel (C): 4 kHz at 44 dB SPL and panel (D): 6 kHz at 40 dB SPL. Significant CAP reductions were obtained with contralateral acoustical stimulation at 2 kHz (two tailed t-test, T(30) = 15.324, p = 9.919*10−16), 3 kHz (two tailed t-test, T(30) = 18.924, p = 3.150*10−18), 4 kHz (two tailed t-test, T(30) = 9.920, p = 5.509*10−11) and 6 kHz (two tailed t-test, T(30) = 18.391, p = 6.957*10−18).

