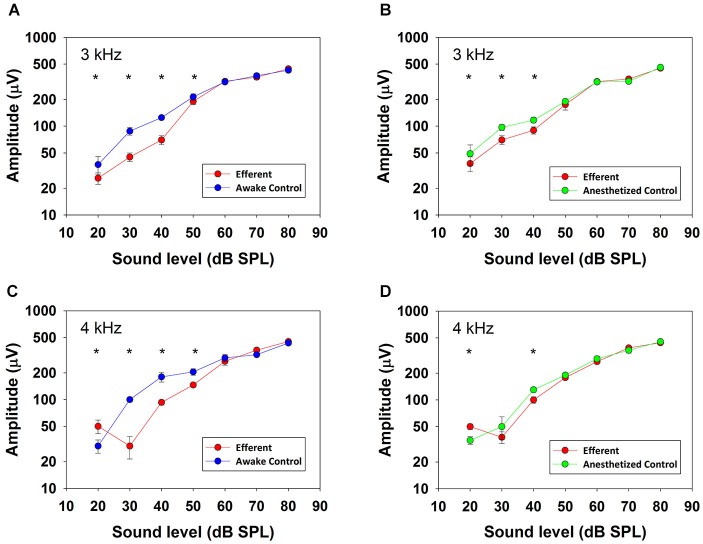
Figure 4.
CAP input–output curves. CAP amplitudes obtained in one chinchilla without (blue and green) and with (red) contralateral acoustical stimulation (broad-band noise at 50 dB SPL) in awake (blue) and anesthetized (green) condition. Vertical lines indicate standard deviations. Efferent-activation produced by contralateral stimulation is more effective at low ipsilateral stimulus intensities and efferent reductions are higher in awake than in anesthetized animals. Asterisks indicate statistically significant differences. Panel (A): 3 kHz, 20 dB: (Mann-Whitney, U(32) = 30.0, T = 1522, p < 0.001); 3 kHz, 30 dB: (Mann-Whitney, U(32) = 0.0, T = 528.0, p < 0.001); 3 kHz, 40 dB: (Mann-Whitney, U(32) = 0.0, T = 1522.0, p < 0.001); 3 kHz, 50 dB: (Mann-Whitney, U(32) = 126.0, T = 1426.0, p < 0.001). Panel (B): 3 kHz, 20 dB: (Mann-Whitney, U(32) = 170.0, T = 1382.0, p < 0.001); 3 kHz, 30 dB: (Mann-Whitney, U(32) = 5.0, T = 1547.0, p < 0.001); 3 kHz, 40 dB: (Mann-Whitney, U(32) = 0.0, T = 528.0, p < 0.001). Panel (C): 4 kHz, 20 dB: (Mann-Whitney, U(32) = 266.0, T = 1286.0, p < 0.001); 4 kHz, 30 dB: (Mann-Whitney, U(32) = 0.0, T = 528.0, p < 0.001); 4 kHz, 40 dB: (Mann-Whitney, U(32) = 0.0, T = 528.0, p < 0.001); 4 kHz, 50 dB: (Mann-Whitney, U(32) = 179.0, T = 707.0, p < 0.001). Panel (D): 4 kHz, 20 dB: (Mann-Whitney, U(32) = 266.0, T = 1286.0, p < 0.001); 4 kHz, 40 dB: (Mann-Whitney, U(32) = 2.0, T = 1550.0, p < 0.001).

