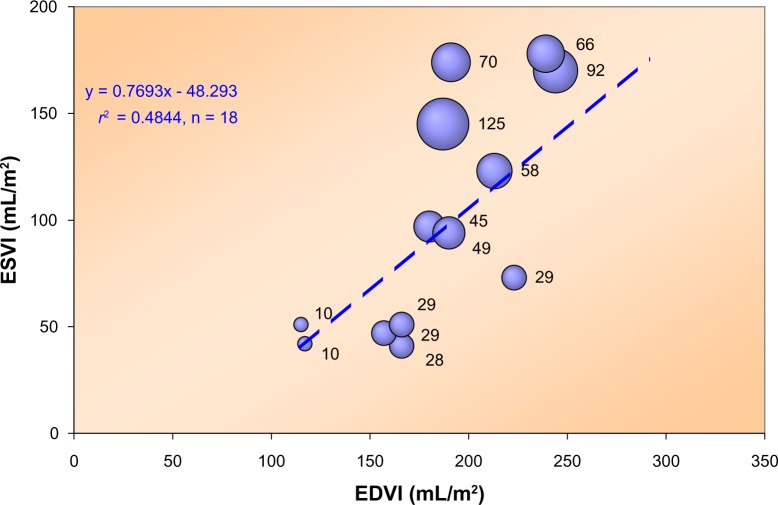
Figure 6.
Relationship between ESVI and EDVI for 18 patients with varying degrees of LV dysfunction, described by Grossman et al.92
Note: The bubble size reflects the value of the volume intercept (expressed as mL/m2 with actual number indicated next to each bubble) of the end-systolic pressure–volume relationship. Clearly, this intercept tends to increase for larger values of ESVI. As a matter of fact, we found an excellent linear relationship (r2 = 0.62 with P < 0.001) between ESVI (control values) and the intercept. Pressure refers to the dicrotic notch level.

