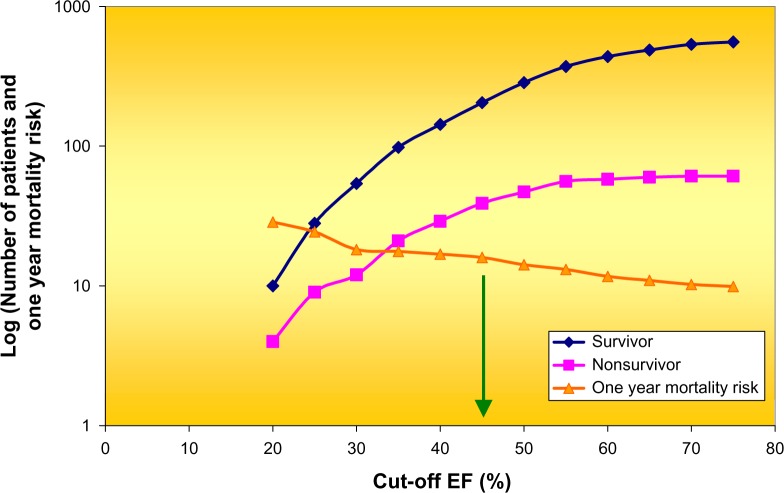
Figure 8.
Cumulative distribution of survivors (n = 569) and non-survivors (n = 63) of acute MI plus the one-year mortality in dependence of break point selected for EF. An EF of less than 45% (see green arrow) best defined a high-risk group. Note the logarithmic scale along the ordinate. Data derived from Ahnve et al.116

