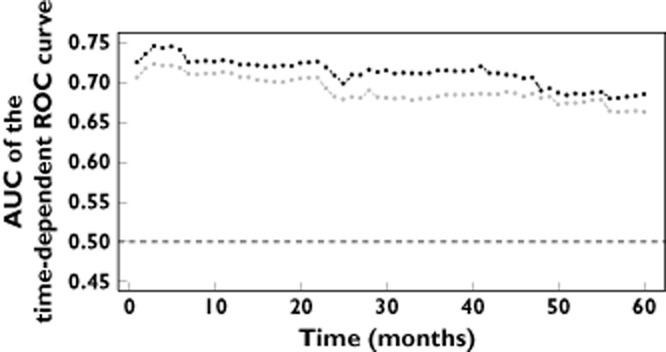
Figure 3.

AUC of the time-dependent ROC curves obtained on the cross-validated predictions of the model with (black) and without (grey) multilocus genetic risk score.  , Cox reression equation including the indicator of a multilocus genetic risk score >=4;
  , Cox reression equation without the indicator of a multilocus genetic risk score >=4
