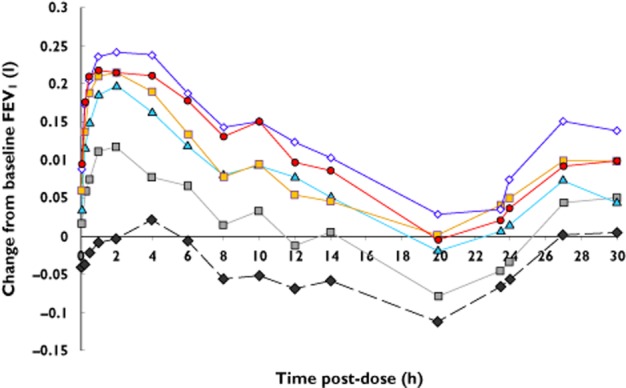
Figure 2.

Mean change from baseline FEV1 after different doses of nebulized glycopyrrolate. The first assessment at 5 min post-dose is displayed at 0 h.  , placebo;
  , 12.5 μg;
  , 50 μg;
  , 100 μg;
  , 200 μg;
  , 400 μg

Mean change from baseline FEV1 after different doses of nebulized glycopyrrolate. The first assessment at 5 min post-dose is displayed at 0 h.  , placebo;
  , 12.5 μg;
  , 50 μg;
  , 100 μg;
  , 200 μg;
  , 400 μg