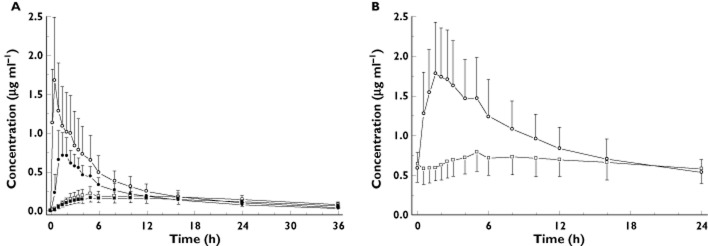
Figure 2.

Concentration–time curves of flupirtine and its acetylated metabolite D13223 after intravenous flupirtine infusion and single dosing of flupirtine IR (A) and after chronic administration of flupirtine MR in 24 healthy subjects (B).  , flupirtine i.v.;
  , flupirtine IR;
  , D13223 i.v.;
  , D13223 (IR);
  , flupirtine MR;
  , D13223
