
Figure 1.
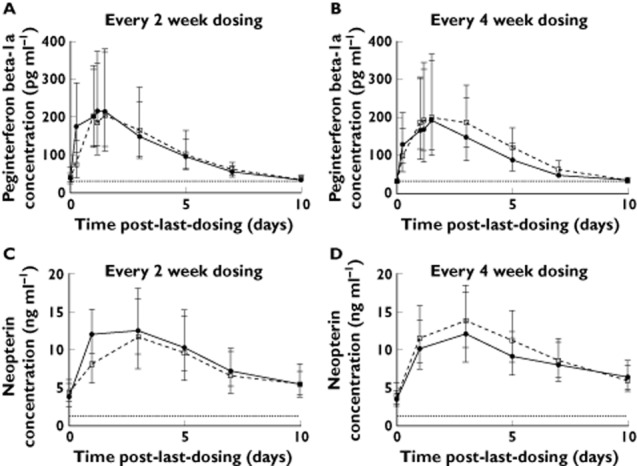
Peginterferon beta-1a concentration-time profiles (A and B) and neopterin concentration−time profiles (C and D) from intensive subjects. Circles represent geometric mean concentration at week 4; squares represent geometric mean concentration at week 24; error bars indicate 95% confidence interval; dotted lines represent lower limit of quantitation, 31.3 pg ml−1 and 1.29 ng ml−1 for peginterferon beta-1a and neopterin, respectively