
FIGURE 1.
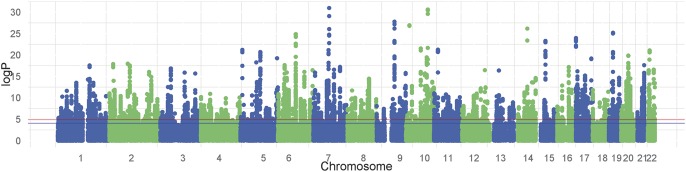
Manhattan plot showing unadjusted P-values of all tested cis-eQTLs in rectal tissue. The blue line indicates significance at FDR 5% (reached by 56,186 probe-variant pairs), and the red line indicates significance at FDR 1%.
Official websites use .gov
A
.gov website belongs to an official
government organization in the United States.
Secure .gov websites use HTTPS
A lock (
) or https:// means you've safely
connected to the .gov website. Share sensitive
information only on official, secure websites.
Manhattan plot showing unadjusted P-values of all tested cis-eQTLs in rectal tissue. The blue line indicates significance at FDR 5% (reached by 56,186 probe-variant pairs), and the red line indicates significance at FDR 1%.