
FIGURE 2.
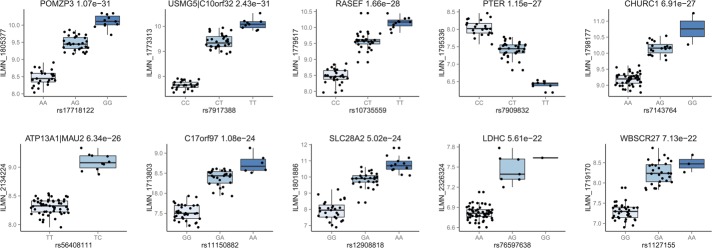
Box plots for the 10 best eQTLs identified in the rectal dataset sorted by P-value. Adjusted Illumina expression intensities are plotted against SNP genotypes. The name of the gene and unadjusted P-values are indicated for each association.