
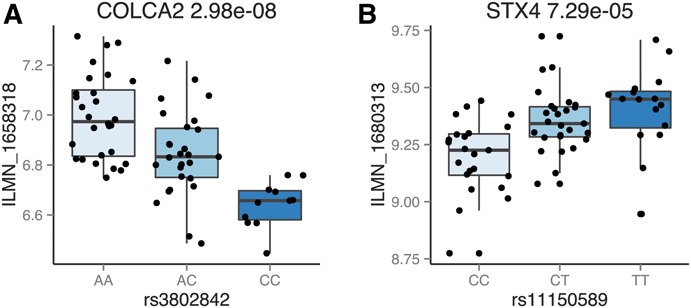
FIGURE 3.
Box plots for COLCA2 (A) and STX4 (B). In (A), the C risk genotype is associated with decreased COLCA2 expression.
Official websites use .gov
A
.gov website belongs to an official
government organization in the United States.
Secure .gov websites use HTTPS
A lock (
) or https:// means you've safely
connected to the .gov website. Share sensitive
information only on official, secure websites.
Box plots for COLCA2 (A) and STX4 (B). In (A), the C risk genotype is associated with decreased COLCA2 expression.