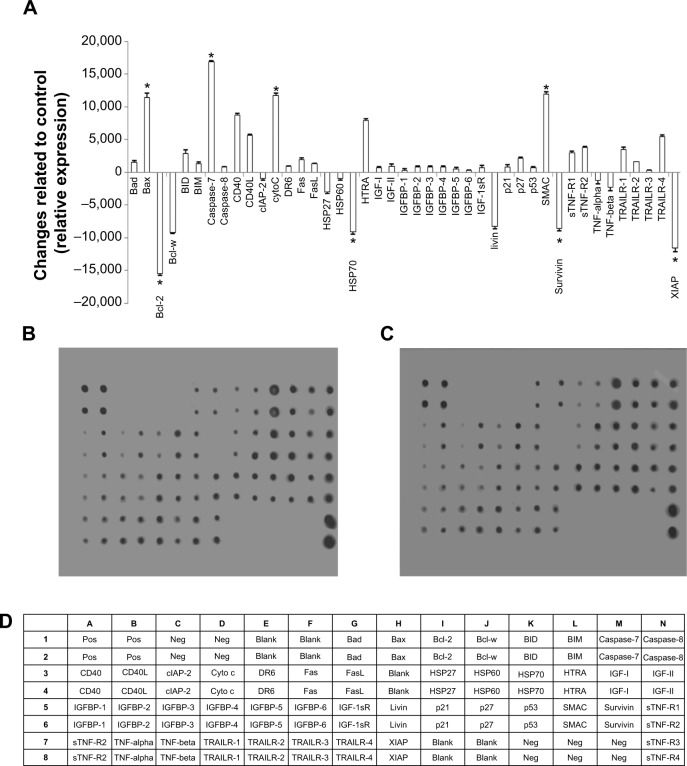
Figure 8.
Quantitative analysis of the human apoptosis proteome profiler array in koenimbin-induced MCF7 cells. MCF7 cells were lysed and protein arrays were performed. Cells were treated with koenimbin 9 μg/mL for 24 hours and total cell protein was extracted. Equal amounts (300 μg) of protein from each control and treated sample were used for the assay. Quantitative analysis of the arrays showed differences in the apoptotic markers.
Notes: The graph shows the difference between treated cells as well as untreated control cells (A). Representative images of the apoptotic protein array are shown for the control (B), treated (C), and the exact protein name of each dot in the array (D). The results are shown as the mean ± standard deviation for three independent experiments. *Indicates a significant difference from control (P<0.05).

