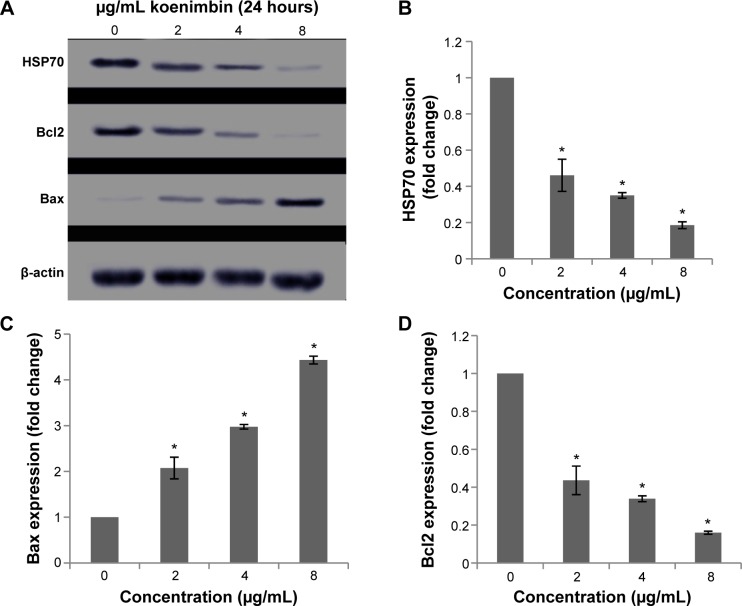
Figure 9.
Western blot analysis of koenimbin in selected apoptotic signaling markers.
Notes: The blot densities are expressed as fold of control (A). The HSP70 protein level was also downregulated, showing significant changes on treatment with koenimbin 4 and 8 μg/mL (B). The Bax (C) and Bcl2 (D) apoptotic markers were significantly elevated and reduced respectively, in a dose-dependent manner. The data are shown as the mean ± standard deviation (n=3). *P<0.05 versus control.
Abbreviation: HSP, heat shock protein.

