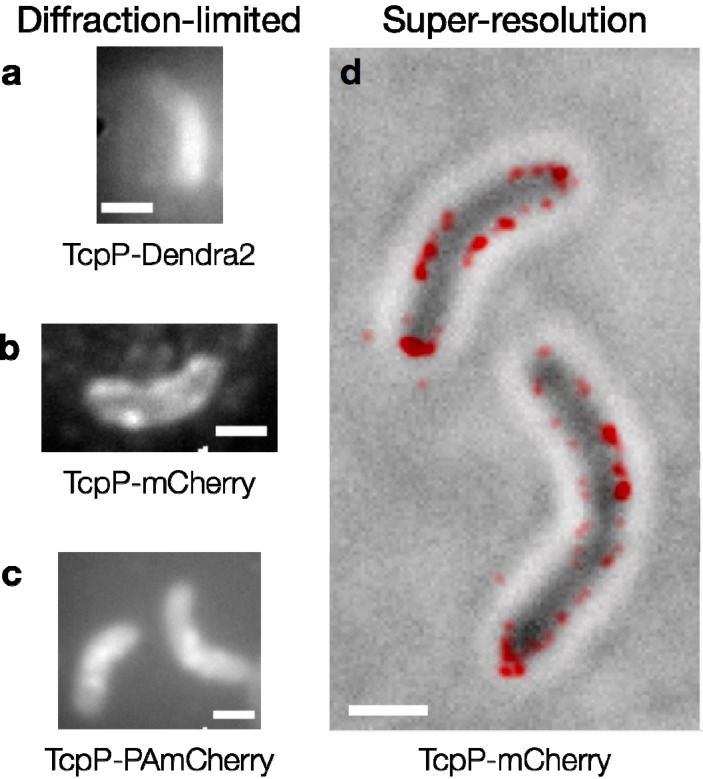
Figure 5.
Fluorescent proteins in V. cholerae cells. Diffraction-limited fluorescence images of cells expressing (a) TcpP-Dendra2; (b) TcpP-mCherry and (c) TcpP-PAmCherry. Individual TcpP-Dendra2 molecules are not observed, and the cells in (a) are dimmer than those in (b) and (c). Bright foci are seen in the cells expressing TcpP-mCherry and TcpP-PAmCherry (b, c). Image acquisition times: 2–5 s; (d) TcpP-mCherry localizes to the cell membrane. Red: super-resolution image (based on 98 100-ms imaging frames) reconstructed from sequential localizations blurred to the 95% confidence intervals of each fit. This PALM image is plotted on top of a reverse-contrast bright field image of the cells (grey). Scale bars: 1 µm.

