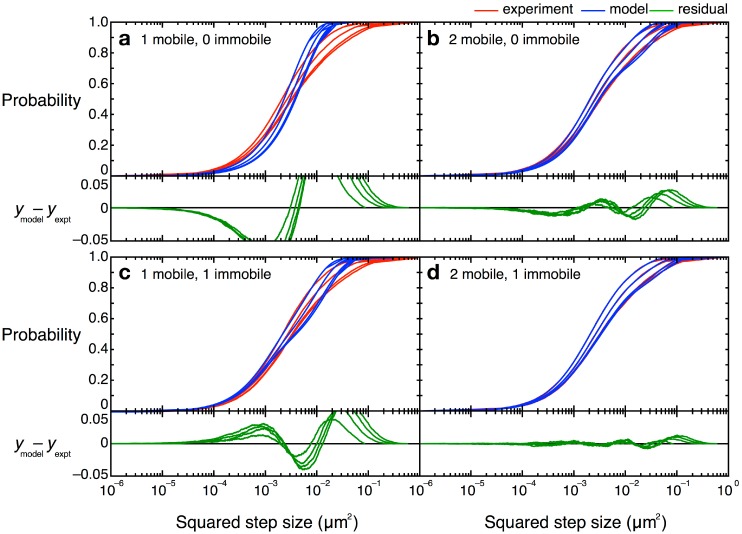
Figure 12.
CPD curves and alternative models for TcpP-PAmCherry diffusion. Experimental data are shown in red and best fits for each of the given models are shown in blue. Curves for the first four time lags (50–200 ms) are plotted left to right. Residuals are shown in green. (a–c) Models with fewer than three terms did not describe the data well; (d) A model with two mobile terms and one immobile term described the CPD data best. Figure from reference [46].

