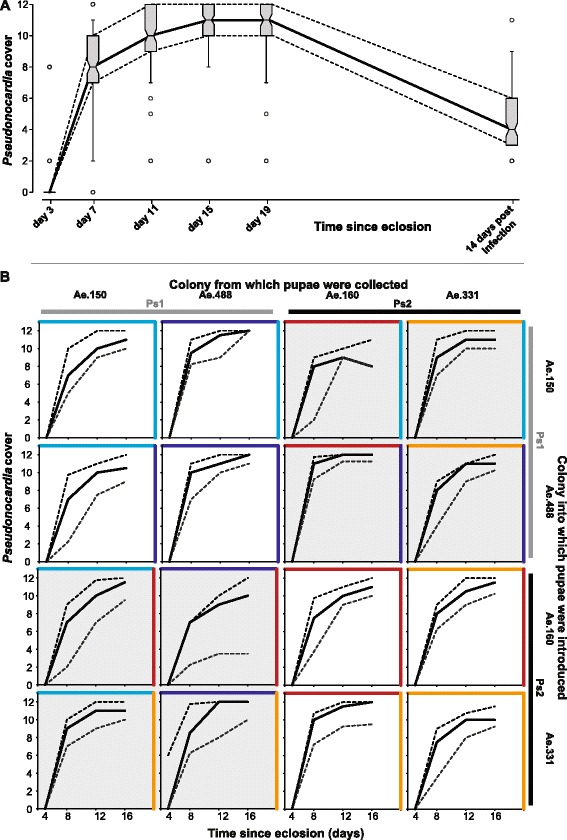
Figure 2.

Bacterial growth rates on ant cuticles. A. Boxplot of the bacterial cover scores of all individuals from all subcolonies from day 0 – 19 and 2 weeks after Escovopsis infection: Box-and-whisker plots, with the middle band representing the median, the bottom and top of the boxes representing the 25th and 75th percentiles, the lower and upper whiskers the 5% and 95% percentiles, and points beyond these shown as open circles. At day 0 all individuals had a score of 0. B. Bacterial cover scores with the solid lines showing the median cover and the dashed lines indicating the 25% and 75% percentiles for all individuals in the two replicate subcolonies for each treatment. For each plot the source colony of the fungus garden and the pupae is indicated, in addition to the identity of the native Pseudonocardia phylotype (colors as in figure 1). White background plots are crossings of the same phylotype inoculating ants of another colony having the same Pseudonocardia, and shaded plots are crossings where gardens/nurses and pupae were from colonies with a different Pseudonocardia phylotype.
