
Figure 6.
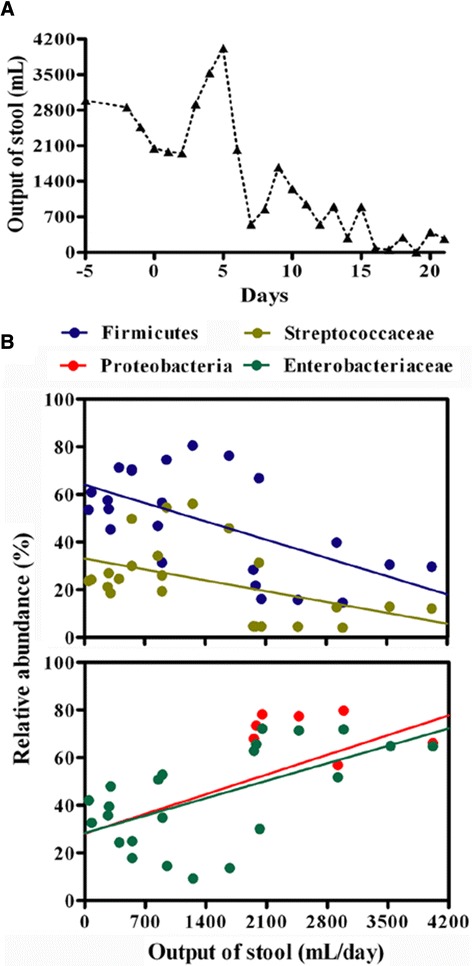
Stool output of the patient and the association with specific bacterial phylogroups. (A) Variations of fecal output in the patient after fecal microbiota transplantation. Total volume of the stool was documented each day. (B) Correlations of the relative proportions of Firmicutes, Streptococcaceae, Proteobacteria and Enterobacteriaceae with stool output per day. Correlation between two variances was estimated using linear regression analysis with a Pearson test.