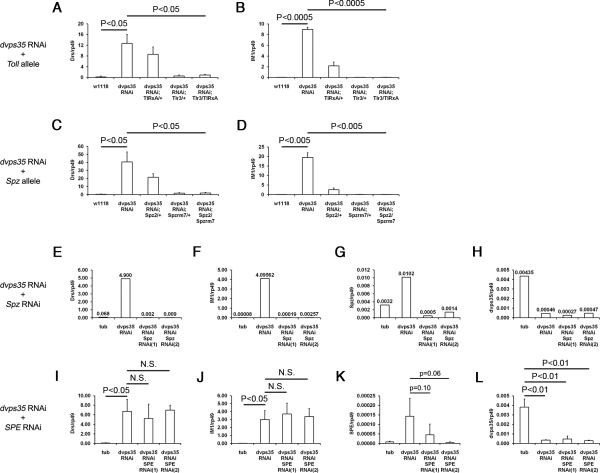
Figure 5. Genetic epistasis analysis places the action of retromer at the level of Spz.
(A and B) Expression level of (A) Drs and (B) IM1 in third instar larvae of wild type and tubGal4-dvps35RNAi with different combinations of Toll hypomorphic (Tlr3) or null (TlRxA) alleles. (C and D) Expression level of (C) Drs and (D) IM1 in third instar larvae of wild type and tubGal4-dvps35RNAi with different combinations of Spz null alleles (Spz2 and Spzrm7). (E-H) Expression level of (E) Drs, (F) IM1, (G) Spz and (H) dvps35 in third instar larvae of tubGal4, tubGal4-dvps35RNAi, tubGal4-dvps35RNAi-SpzRNAi(1) and tubGal4-dvps35RNAi-SpzRNAi(2). (I-L) Expression level of (I) Drs, (J) IM1, (K) SPE and (L) dvps35 in third instar larvae of tubGal4, tubGal4-dvps35RNAi, tubGal4-dvps35RNAi-SPERNAi(1) and tubGal4-dvps35RNAi-SPERNAi(2).

