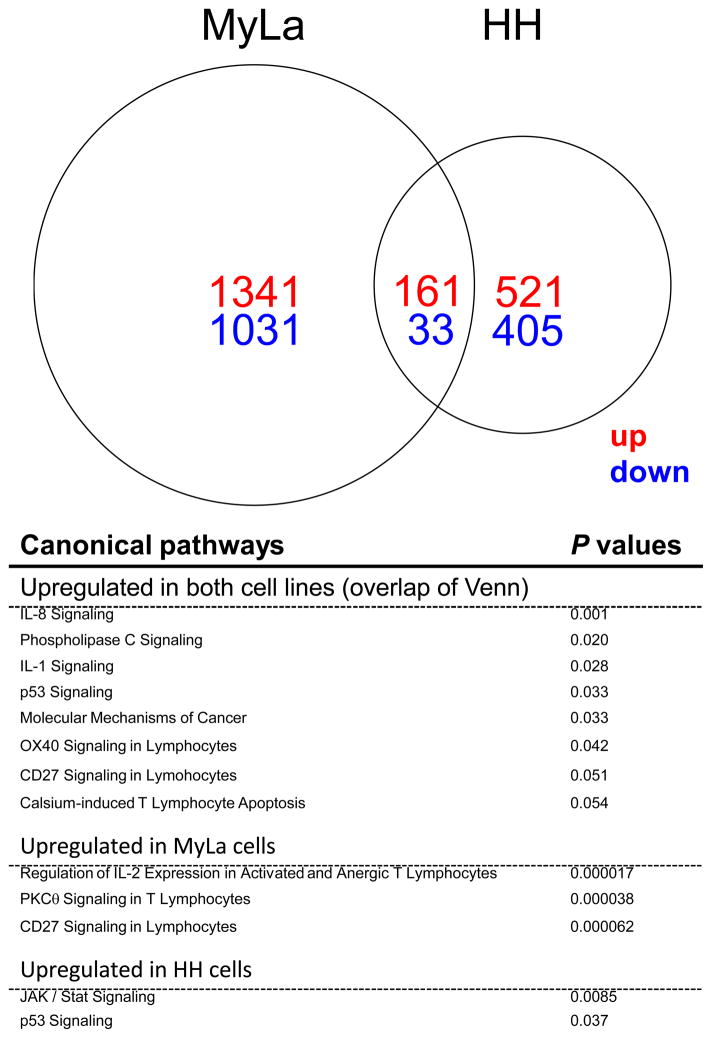
Figure 4.
IL-32 prompts cell activation and cancer related pathways. A Venn diagram reveals the numbers of up-regulated (red) and down-regulated (blue) probe sets in IL-32-treated MyLa cells and / or HH cells. Significantly up-regulated canonical pathways (p<0.05) and selected canonical pathways (with p values close to 0.05) in IL-32-treated MyLa cells and / or HH cells are shown with P values.

