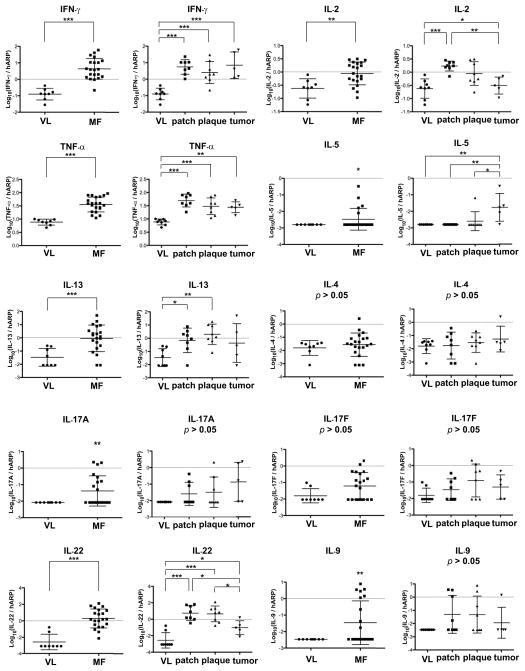
Figure 5.
Only IFNγ shows consistently increased mRNA expression in MF lesions. mRNA expression levels of various cytokines in the skin of VL and MF. Horizontal bars are mean ± SD. For IL-5, IL-17A, and IL-9 mRNA expression levels, a one sample t-test was done to compare the non-identical values to the identical values only in MF lesions. The percentages of samples showing non-identical values are 23.8% (IL-5), 42.9% (IL-17A) and 42.9% (IL-9). *P<0.05, **P<0.01, ***P<0.001.

